Intraday traders in Nifty seem to be enjoying their time ... But, it seems the positional traders are stressing out... 5200 is surely the psychological level for the 'elusive' break out!
If that comes, you are again on a bull rise and if not .. well we remain in 'No man's land' . What seems to be difficult for traders is the ability to change the view , but I think - like always - let prices decide . "Price is King" !! We are but humble followers of the King!
The Nifty level of 5115 is crucial for intraday while 5200 should be treated as break out level on upper side.... The FII theory, indicated yesterday, still remains and we must be ready for 'false breakouts' especially since US markets and players will be in holiday mood from tomorrow (Dec 25)...
In coming days , be ready to change your view fast and frequently .... if you are not able to do that - well, you too can take a 'Christmas holiday'!
I see a lot of action and trends in commodities markets - especially the metals. a second phase of upmove seems to be starting . . .
And yes - Do enjoy your 'Christmas holidays' - 'Market mein movement to chalta rahegaa"
Happy trading
CA Rajiv D Khatlawala
ValueTrade Academy Pvt Ltd.
Thursday, December 24, 2009
Wednesday, December 23, 2009
NIFTY - a good rally ? ?
The stock markets moved beyond what any one (almost) could have thought of yesterday. A 3% jump!!
The discussed and cited reasons was the 'optimism' of the market over the FM's statement (again!) of a 10% GDP growth . . . That's called - keeping the hope alive!
Well but can it not be one more instance of the 'age-old' reason of improved FII NAVs before they pack their bags for Christmas? Today's rally surely would help them a lot. . . (I wonder why we never have such rallies on Diwali day - when WE close our books)
Also one more thing which actually 'surprised' me today was the fact that while the stock markets rallied 3%, the USDINR was actually up 3p!!!!! This fact actually triggered in my mind, the theory of a FII engineered rally .
What we need to see is that whether this rise will be avble to break beyond 5200. The indicators are still negative and hence I shall not take an anticipatory opinion. Let prices ,as always, tell us what to do...
For tomorrow Nifty 5165-5175 range becomes crucial for intraday . Watch out
Happy trading!
CA Rajiv D Khatlawala
ValueTrade Academy Pvt Ltd.
Tuesday, December 22, 2009
GOLD - time again to glitter ?
Yesterday I saw one of the TV Channels giving out trophies for "Indian of the Year' !! While watching it, what went through my mind was that , if at all, the trophy of the "Indian of the Year' must have gone to "The Indian Investor" !! who came out of the roller coaster ride of the past few months and more importantly - this achieved, inspite of the economy!
Time to watch where Gold is moving. After testing the magical figure of $1225 , it has since retraced back towards $ 1100 and below. This was bound to happen as the race towards $1225 was 'parabolic' and steep.
The GOLD Chart (in $ terms - not MCX) suggests that a further fall towards $1075 and below should actually provide short term traders an opportunity to buy it for a quick rebound. I presume this should correspond to about Rs 16300 price range on MCX.
Though the indicators have started to weaken, there is a high possibility of a rebound from the oversold level - below $1075. . .
Watch out !
CA Rajiv D Khatlawala
ValueTrade Academy Pvt Ltd.
Monday, December 21, 2009
CNX IT - may reverse any time ....
The Nifty continued its weakness as expected... Frontline stocks took to profit booking and the recent movements of the IT sector stocks too are not encouraging.
The CNXIT index seems to be nearing a reversal point and one can expect it to 'help' in the downward journey of the Nifty.
The CNX IT index has crucial support at 5645 - based on intraday charts. A break below this should start the down move. the daily charts should later suggest weakness on the breaking of the crucial 5600 level.
Investors who are still holding their IT winners, may consider profit booking...
Happy Trading !
CA Rajiv D Khatlawala
ValueTrade Academy Pvt Ltd.
Friday, December 18, 2009
Natural Gas - Tomorrow's CrudeOil ??
The Nifty broke the crucial 4990 ... And that too on a weekend... At least the suspense is diluted! I presume now most of the traders and investors are 'deciding' their next moves....
Recently I read an altericle on 'alternative fuel for the future' and one of the conclusions was that since Crude Oil is relatively costly, Natural Gas has the potential for eating away Crudeoil's market share in the energy space...
Well, earlier there was a high positive correlation between Crude and NatGas which was recently (past 2 years) violated. Even when Crude rose, Nat Gas had been falling... So now if Crude is 'not rising' will NatGas rise ? ?
That promtped me to check the price behaviour of NatGas. It seems NatGas prices are changing their trend.
From the recent downward trend of the past one-and-half year, the trend is clearly changing on upside. The long term MAs too are suggesting trend change. While my long term RSI (not shown here) is already in buying mode...
I shall not be surprised if NatGas price shoots up towards Rs 310 initially and then to Rs 360/- on the MCX !!
Happy trading !
CA Rajiv D Khatlawala
ValueTrade Academy Pvt Ltd.
Thursday, December 17, 2009
USD INR ... trend changing ?
The Nifty again 'bored' the players today. But since technical signals are weakening, it may be a question of time before it breaks the crucial 4990
As for the USDINR, which has a inverse correlation with the markets, it is showing signs of strenghtening. It touched a high of 47/- today and close at 46.90.
Some technical indicators are suggesting a change in trend while a couple of advanced indicators suggest that it would gain momentum in the coming days ...
And if that happens, the Nifty down break of 4990 may be imminent.
Incidentally, I presume the CNXIT index too which was strong , is showing some 'initial' signs of exhaution.... Next couple of days working should be able to throw more light. . .
Happy trading !
CA Rajiv D Khatlawala
ValueTrade Academy Pvt Ltd.
Wednesday, December 16, 2009
BankNifty - May lead the market down!!
The NIFTY today touched a low of 5004 and recovered to test the resistance of 5070-80 range. This may be treated as corrective rise as suggested yesterday.
Sector wise, the 'old economy' and the banking stocks are down while the 'Techies' are quite strong. The CNXIT index is getting stronger but at the same time Bank Nifty is weakening.
The Price chart of BankNifty suggests that it is very near to changing its trend on downside and the Price charts are also showing some 'interesting' price patterns ( Yes I think I will discuss this further today in my Technical Analysis batch).
Well , those of you who hold banking stocks in your trading or investment portfolio, be careful... a 10% fall from current levels is highly likely and this may well be the reason for the Nifty to break the crucial 4990 level....
Happy 'profit booking'
CA Rajiv D Khatlawala
ValueTrade Academy Pvt Ltd.
Tuesday, December 15, 2009
Nifty - Momentum Lost !!
The Nifty held on to the crucial intraday support of 5080 for long before giving in... The break of this intraday support saw it lose another 60 points and giving a bearish candle.
The indicators are suggesting falling momentum and hence upmoves should be treated as corrective annd should be used to exit long positions... In fact I have been writing often, that as a trader I would be more comfortable only beyond 5200 !!
Weakness seems to be setting in and a close below 4990 should speed up the fall towards 4800 ... And yes pray that the markets hold 4800 levels ... if that breaks.... well..... (don't worry - we shall analyse when it happens)
Many frontline stocks are giving sell signals and I presume those of you who are active stock traders can surely find something juicy to short sell!!
Happy Trading !
CA Rajiv D Khatlawala
ValueTrade Academy Pvt Ltd.
www.investogyan.com
The indicators are suggesting falling momentum and hence upmoves should be treated as corrective annd should be used to exit long positions... In fact I have been writing often, that as a trader I would be more comfortable only beyond 5200 !!
Weakness seems to be setting in and a close below 4990 should speed up the fall towards 4800 ... And yes pray that the markets hold 4800 levels ... if that breaks.... well..... (don't worry - we shall analyse when it happens)
Many frontline stocks are giving sell signals and I presume those of you who are active stock traders can surely find something juicy to short sell!!
Happy Trading !
CA Rajiv D Khatlawala
ValueTrade Academy Pvt Ltd.
www.investogyan.com
Monday, December 14, 2009
CRUDE OIL ... Not boiling !!
The Nifty again played spoil sport ! .. In the morning even though Asian markets were down, the Indian markets opened positive and again attempted to go near to 5182, failed and then closed near 5100. Keep an aye on 5065!
One of the recent 'hot' news is that CRUDEOIL fell below $70 (currently at $68). While I expected that in the recently concluded rally, Crude oil would go near Rs 4000/- on MCX, it essentially fell short of it due to the exchange rate.
It has broken an important support of Rs 3450/- (on MCX). This suggests further weakness and down target could be at Rs 3150 initially.
What is more worrying is that the recent rise during the last few months was not strong enough to take it to the 50% retracement.
Would this fall in Crude oil bring the stock markets down? When Crude oil was rising, the fundamental analysts, were screaming that it is a sign of 'economic recovery' as demand for crude seem to have risen and hence stock markets were gaining. Now that Crude oil is falling will they talk of reverse logic ? Or will they find some other (convenient)reason for the rising US stock market????
Happy trading
CA Rajiv D Khatlawala
ValueTrade Academy Pvt Ltd.
www.investogyan.com
One of the recent 'hot' news is that CRUDEOIL fell below $70 (currently at $68). While I expected that in the recently concluded rally, Crude oil would go near Rs 4000/- on MCX, it essentially fell short of it due to the exchange rate.
It has broken an important support of Rs 3450/- (on MCX). This suggests further weakness and down target could be at Rs 3150 initially.
What is more worrying is that the recent rise during the last few months was not strong enough to take it to the 50% retracement.
Would this fall in Crude oil bring the stock markets down? When Crude oil was rising, the fundamental analysts, were screaming that it is a sign of 'economic recovery' as demand for crude seem to have risen and hence stock markets were gaining. Now that Crude oil is falling will they talk of reverse logic ? Or will they find some other (convenient)reason for the rising US stock market????
Happy trading
CA Rajiv D Khatlawala
ValueTrade Academy Pvt Ltd.
www.investogyan.com
Friday, December 11, 2009
Nifty - an DOJI week!!
The Nifty gets surely nervous as it approaches 5200 ... Market psychology and Market comfort zones in action!! ... (my particpants would know what these are )
Well, It seems we have another week with a DOJI candle on the Nifty. The daily charts are going sideway suggesting the inherent confusion.
Scrip specific moves are rampant. And I am sure those who traded Bharti Airtel (analysed on this blog on 4th Dec when price was Rs 315/-. The target indicated of Rs 345 is achieved...
I presume sector wise telecom remains good in a down move but we shall analyse the stocks at appropriate time..
I expect that the Nifty support now of 5065 is important and below this, slide of another 100+ points not ruled out ... Keep a watch on Reliance !
Happy trading
CA Rajiv D Khatlawala
ValueTrade Academy Pvt Ltd.
Wednesday, December 9, 2009
USD INR turning +ve !!
The Nifty did give a good rise yesterday but the Dow Jones and Asian markets showed weakness.... This is 'normal'...
The saying goes 'The only thing that is constant is Change' ... We 'marketmen' can redraft this as 'Only thing that will be constant is confusion (read volatility)'...
The Dollar index rise gave jitters to Gold , Crude, Silver and other metals ... I expect that the rise in dollar against the rupee too is likely.
USDINR charts suggest a good support near Rs 46/- which is the 50% retracement level of the entire rise from Rs 39/- to Rs 53/-. And now a break out above Rs 47.20 should be able to generate more steam and hence put huge pressure on the rupee...
Overall the USDINR has good support at Rs 46 levels and unless this is broken downward, expect the rupee to depreciate further !!
Happy tracking!
CA Rajiv D Khatlawala
ValueTrade Academy Pvt Ltd.
Monday, December 7, 2009
Dollar rises - Will stocks and Commodities fall?
One of my regular readers of this blog seem to have read my mind too!
Well I have been closely tracking the Dollar (Dollar index) for the past few days to get some better idea of how stocks and commodities should behave in coming days.
Gold and Silver went in to correction and lost their technical momentum. Stock indices worldwide too seem to be losing their recent momentum...
Dollar Index is surely on a rebound path with technical parameters favoring a further rise.
Well , that should surely mean that stocks , metal and bullion may go in correction or sideway mode (depending on their individual strength)
As of Nifty - Watch out for the 5030 level !!
CA Rajiv D Khatlawala
ValueTrade Academy Pvt Ltd.
Friday, December 4, 2009
Bharti Airtel - Line clear ?
The Nifty seems to be 'fighting' with the 5100+ levels and upmoves are getting resistances. A fall from these levels below 5030 in next few days, could be negative for the markets in the medium term (Why? ... in next blog post)
Bharti Airtel has the tendency to be the contrarian index stock. Currently it is showing signs of 'bottoming' out and I expect that a break above Rs 315/- should trigger buying interest which can take to Rs 345 initially and then to Rs 370 levels.
The Rs 375 levels should give a strong resistance to prices.
Happy trading - but be careful with other stocks / nifty!
CA Rajiv D Khatlawala
ValueTrade Academy Pvt Ltd.
Thursday, December 3, 2009
Tata Motors - Reverse gear ?
The Nifty has been making a 'doji' pattern for two days - suggesting high confusion among market players. 5100 Nifty is the area beyond which market players are not comfortable.
As for individual stocks which gave initial signals of fatigue is TATA MOTORS.
Today the stock has formed what we call a 'Bearish engulfing' candle stick pattern. The pattern suggests a break to the ongoing uptrend and signals of fatigue.
Investors who hold this stock may want to book profits and keep some money in the bank !
A break below 700/- will be treated further negative.
(Incidentally - My Basic Fundamental Analysis (yes you read it right) course is scheduled on Sat 5th Dec. More information - www.investogyan.com)
Happy profit booking !
CA Rajiv D Khatlawala
ValueTrade Academy Pvt Ltd.
Tuesday, December 1, 2009
Suzlon . . Positive winds ..
The Nifty touched the overhead resistance near to 5130 and has closed above this level. A good and strong rebound from the 'Dubai' panic. Intraday traders watch the 5085 levels for tomorrow ... !
Well stock specific - Suzlon seems to be generating buying interest yet again.
The technical indicators - especially the RSI - suggests that the buying momentum is building up and that investors who can take a risk of Rs 15/- in this stock can targets the Rs 110 - 115 levels in days to come. ..
Woops - mid caps are turning up again .. More than meets the eye ???
And yes, all bullion traders out there - watch Silver - a break beyond $19 should see lot of action ....
Happy trading !!
CA Rajiv D Khatlawala
ValueTrade Academy Pvt Ltd.
Sunday, November 29, 2009
Nifty - On dangerous grounds !
Friends, I am delighted to tell you that the launching of my Academy - a dream project - had a thundering start!! I thank all of you for the continuous support you have given me over the years and this will make me stronger in future. Thanks !
The markets - they got a reason they seem to be waiting for. The Dubai debacle acted as the trigger for a sell off in an overvalued and nervously bullish market. In my previous blog on the day of Nov expiry - I indicated that Nifty 5050 was 'crucial' and if broken, may lead to a further sell off.
Well it seems that now 5100 + levels may be difficult to cross at least in the next few weeks and we can look for an immediate support at 4750. Below this I shall exit any longs in the market and may be shift my energies towards options, currencies and commodities.
The medium term indicator - ADX DI seems to be suggesting ' Caution - Danger ahead'
Well for now we have a situation of 'Caveat Emptor' (Latin words for 'Buyer Beware')
Happy trading! and remember - Don't fear the markets, respect them!!
CA Rajiv D Khatlawala
ValueTrade Academy Pvt Ltd.
Wednesday, November 25, 2009
NIFTY - Nov Expiry at ? ? ?
Hello Friends !.. Sorry for updating every second day. As you all are aware I am fully concentrating my efforts right now of the Launch of my Academy - on this Saturday 28th Nov. !!
I am sure that those of you who are in and around Baroda will attend the Launch and make the event a success. (Details at www.investogyan.com)
As for the Nifty - it is behaving as it usually does . And yes whenever I see the top gainers of the day having defensive stocks like ITC and HLL , I become extra alert! What's cooking ???
Well , time shall surely tell but the intraday charts are suggesting a very crucial support at 5052 and a break below this tomorrow may give way to a further sell off.
And before I forget - while one of your favorite TV channels is 'exploring' an 'informed(?)' discussion on the similarities of the current rise with that of Jan 2008, I presume the price behavior is still not suggesting such an extreme situation. Well we can understand - they need something to keep the register ringing !!
Well this much for now - See you at the Academy !
CA Rajiv D Khatlawala
ValueTrade Academy Pvt Ltd.
Monday, November 23, 2009
LT . . Too long a correction !
My Blog readers who traded in Gold , Silver and Copper sure must be partying right now!! Commodities are on a roll. Nifty on the other hand seems to be stuck in a range in search of a direction.
One of the few frontline stocks Larsen seems to be finding strong resistance at Rs 1700 levels while support is now important at 1500/-. A break out of this range should only decide the next move (Wow - a great opportunity for derivative traders )
Moreover while the price pattern looks like a triangle - it may not be actually defined as a triangle (Why ? - Think hard)
The charts suggest that upside break out may not give a heavy move but a downside break out can be fast and deep. All investors in the stock - keep SL at 1500/-
Happy trading !
CA Rajiv D Khatlawala
ValueTrade Academy Pvt Ltd.
Thursday, November 19, 2009
JSW Steel - Buy on rumor , sell on Fact !!
The Nifty is unable to sustain beyond 5100 which fact is suggestive of topping out. Today's close below 5000 would suggest immediate support at 4940 and a close below this would indicate further weakness.
Today's hot news was the 10% stake sale by JSW Steel to the 6th largest steel company in the world -Japanese Steel maker JFE.
The scrip immediately hit my radar since we can once again prove that prices run ahead of fundamentals. The price of this stock was rising for the past few days from near Rs 650 level on Nov 4 to today's high of Rs 1039/-.
Woops, a technical analyst tracking this stock would have gained most of the rise, even though not aware of the deal, while a fundamental analyst/ investor would only today come to know of a 'good news' !!!
Perhaps at this juncture one should remember the market saying - "Buy on Rumor , Sell on the Fact" -
Fundamental Investors - if you have missed this rise , wait for a correction before jumping in ! The news are good but the timing for purchase is wrong !! (Did I hear someone say it is bad to time the market????)
I presume you can get the stock below Rs 800/- in days to come !
Happy watching !
CA Rajiv D Khatlawala
ValueTrade Academy Pvt Ltd.
Monday, November 16, 2009
COPPER - imminent upside break out !
While Gold touches a new high beyond $1130, Silver which is lagging behind could soon be catching up... And if that is so, a rise in Copper too cannot be far away.
COPPER has been consolidating in the Rs 280 and Rs 310 range for some time and a break is near. The most likely break out is on the upside given the technical indicators strength.
Traders may want to buy the commodity on break out now beyond Rs 310 with a strict stop at Rs 299 for a target initially at Rs 319 and then in the Rs 339-345 range.
Not a bad trade given that many international metals are on the rise.
Happy trading !
CA Rajiv D Khatlawala
ValueTrade Academy Pvt Ltd.
COPPER has been consolidating in the Rs 280 and Rs 310 range for some time and a break is near. The most likely break out is on the upside given the technical indicators strength.
Traders may want to buy the commodity on break out now beyond Rs 310 with a strict stop at Rs 299 for a target initially at Rs 319 and then in the Rs 339-345 range.
Not a bad trade given that many international metals are on the rise.
Happy trading !
CA Rajiv D Khatlawala
ValueTrade Academy Pvt Ltd.
Thursday, November 12, 2009
ICICI Bank - Bearish Engulfing !
The NIFTY seems to be getting selling pressure above 5000 level. Consider immediate support near to 4895 tomorrow for intraday below which a further selling may be expected intitially towards 4865 - 4855
Banking stocks saw some profit booking and selling at higher levels. ICICI BANK in fact has formed a 'bearish engulfing candlestick pattern' on the daily charts.
Resistance to the stock is strong at 930+ while immediate support is near Rs 880/- in intraday. A break below this should create a short sell trade with stop at 930 and target of Rs 800 - 785.
I presume traders may cover their short sell near Rs 775-800 as this is a support area.
Happy trading !
CA Rajiv D Khatlawala
ValueTrade Academy Pvt Ltd.
Wednesday, November 11, 2009
Neyvelli Lignite - consolidation ending!
The Nifty went past the 61.80% retracement level as it shot up beyond 4950. While the price movements in intraday have been quite profitable, the daily charts still remain in sell mode. Advanced indicators still suggest that the rally is 'corrective' in nature.
After recent annoucements, PSUs have been in limelight and one of my favorites is Neyvelli Lignite (yes fundamentally too) .
The scrip seems to be in a consolidation mode between 120 and 145 and I expect a break out above Rs 145 should lead us towards targets near Rs 180 and beyond. Also Rs 110-120 price range is a good support area for the stock where investors may want to accumulate further (obviosuly after checking the charts).
Keep an eye on the volumes and volume based indicators too. . .
Happy trading !
CA Rajiv D Khatlawala
ValueTrade Academy Pvt Ltd.
Monday, November 9, 2009
Bharti Airtel - Wake up Call !
The Nifty broke the resistance of 4850 today and closed higher on back of positive cues from the world markets...
Still treat this as corrective in nature as the major indicators are still in sell mode.
Bharti Airtel is one stock which has been hammered and I presume there are enough indications that the stock has been a victim of over-reaction (as usual)...
Consider a break out level of Rs 320 and major support level of Rs 299. A break out above Rs 320 should give targets in the range of 355 to Rs 370... Return to risk favors the buyer now! .
Short term traders may want to jump in and take benefit!
Happy bottom fishing - should we say ?
CA Rajiv D Khatlawala
ValueTrade Academy Pvt Ltd.
Saturday, November 7, 2009
CNX IT - losing momentum
The NIFTY yesterday touched a high of 4836 vis - vis my given target of 4845 on the previous day... It has closed below 4800..
The CNX IT has been one of the better performing sectoral indices. The CNX IT gained convincingly from the March lows of 2000 to the recent high of 5200... Impressive - considering that most investors and traders were busy with Tiscos and Reliances while the Infosys and Wipros of the world rallied.
That's the way the markets are... Stocks which most people are following , tend to under perform ...
The CNX IT index is currently showing signs of fatigue and losing momentum. Consider 4875 as the crucial support and a break and close below this level should give investors and traders an advance warning to book profits in their IT stocks and encash the mullah!
The level of 5200 is a crucial resistance and unless this is crossed, booking profit is more advisable !
Happy profit booking,
CA Rajiv D Khatlawala
ValueTrade Academy Pvt Ltd.
Thursday, November 5, 2009
Nifty becomes volatile ... as anticipated !
The last 3 days of NIFTY movement can be called nothing but "a trader's delight" !!
In my earlier blog post I had indicated that the Nifty is likely to become volatile. And the last 3 days movement has surely been so. {Also I am sure my blog readers could trade RCOM on break above Rs 170/- .... }
Today's movement towards the first retracement level has been with clear signals on the intraday charts (Those who have attended by advanced course should have traded extremely well in last 3 days especially)
Considering the short term RSI (parameter excluded from analysis), the immediate resistance to the Nifty is at 4785, above which a strong resistance should come near 4845 levels... This can be used as the profit booking level for intraday longs.
Watch the 4688 level. A close below this should now suggest the end of the corrective rise (and resumption of the down move).
Happy volatile trading !!
CA Rajiv D Khatlawala
ValueTrade Academy Pvt Ltd.
Wednesday, November 4, 2009
SILVER - Get ready for the next move. .
The Nifty moves up on correction today . As indicated yesterday, the overall structure remains weak and traders must use this upmove to lighten their longs...
Coming to Commodities, GOLD made a new high yesterday at Rs 16500+ ( I had analysed gold a few days back, I am sure those of you who traded in Gold on the indicated break out of Rs 16000, are smiling from cheek to cheek!! )
SILVER on the other hand seems to have slightly underperformed Gold. But it is time now to have a re-look .....
Silver is taking rest at present and is forming a 'rectangle continuation pattern'.. A rise above Rs 27500 should give a good break out and medium term traders can target a move towards Rs.30,000/-. Keep stoploss at Rs 25750 being the crucial support level.
Commodities markets are likely to perform better than equity markets in the near term - No doubt today's traders need to trade in multiple markets!!!!
Happy trading !
CA Rajiv D Khatlawala
ValueTrade Academy Pvt Ltd.
Tuesday, November 3, 2009
R Com - time to Cover Short !!!
The Nifty moved as analysed . Break below 4730 has created heavy selling pressure and I have indicated target of 4400 levels. While we may see some corrective rise after today's fall, the overall trend still remains weak and there are also no specific signals of bottoming out yet. . . .
Among the stock which started crashing before the markets did, was RCOM. But at the current juncture, the risk - return has twisted in favor of buying ! ...
If you are short, you may cover your position and book profits. Aggresive traders may actually enter the stock on break above Rs 170 with a stoploss near to Rs 160. Target should be initially Rs 190 and then near Rs 210.
Happy Trading !
CA Rajiv D Khatlawala
ValueTrade Academy Pvt Ltd.
Monday, November 2, 2009
BankNifty - targeting 7000 !
The Bank Nifty was one of the better performers of the recent rallies. It almost tripled from 3300 in March to near 9600 in Oct before closing near 8400 last week.
The RSI oscillator has shown weak since 9000 levels while the MACD indicator too signalled caution during this period.
Immediate support is at 8350 levels and a break below this should lead us towards 7000 levels in the next few days ... Resistance on upper side remains strong at 9000 which can be used as the stoploss for short sell positions.
Those investors who may be holding banking stocks may book profits and wait for the correction to re-enter...
Happy profit booking!
CA Rajiv D Khatlawala
ValueTrade Academy Pvt Ltd.
Friday, October 30, 2009
NIFTY - will the fall gather speed ???
My target for NIFTY of 4755 was achieved... I presume the readers of my blog have benefitted...
The NIFTY has taken support near the indicated level of 4755 and has risen today (30-Oct) on the back of a 200 point jump in DOW JONES.... For the next few trading sessions consider 4730 as the support level and a break below this should now lead to a speedy fall towards sub 4450 levels .. The ADX indicatoris indicative of this.
Upmoves should now face resistance at 4865 and 4910 levels where aggressive traders can start building short positions ...
Expect increase in volatility in the coming week...
Happy trading !
CA Rajiv D Khatlawala
ValueTrade Academy Pvt Ltd.
Wednesday, October 28, 2009
SBI - Exit in any rise !!
The Nifty moved more or less as indicated. I had indicated that a break below 4930 should lead us towards 4755... Today (28-Oct) it already touched a low of 4784 (as of 3 pm) ...
One of the recent hero of the rally was SBI and it seems those investors holding SBI in their portfolio may want to exit it.
The technical charts looks like it wants to form a Head and Shoulder formation. The second shoulder (right) is yet to be formed..
There is also a negative divergence on the charts which suggests inherent weakness..
Be careful with your holdings and use any upmove to exit the stock for the time being. Upside seems quite limited from these levels. On down side Rs 1800 levels can now give some short term buying opportunity... .
Happy profit booking !!
CA Rajiv D Khatlawala
ValueTrade Academy Pvt Ltd.
Monday, October 26, 2009
NIFTY - trend weakens... as anticipated. .
The NIFTY trend was indicated to be turning weak (Pl see my last analysis on Oct 5th and Oct 20th).
You would have noticed that for the past 3-4 trading sessions, the market is not able to hold on to upmoves during intraday movements.
While many of the basic indicators have already suggested profit booking, with last couple of days movements, some advanced indicators have gone in 'Sell' mode.
A break below 4930 should lead us now towards 4755 initially levels which is also near to the retracement level of the current ongoing move.
At the current juncture, traders and investor may do well in booking profit in any price upmoves and consider short selling below 4930 levels.
Happy trading and profit booking!!
CA Rajiv D Khatlawala
ValueTrade Academy Pvt Ltd.
Saturday, October 24, 2009
HOCL - coming out of hibernation!
While the NIFTY continues its corrective mood, it may be time to track the mid caps which are bottoming out (there not many left now)
One such stock which came to my radar is HOCL
The scrip has recently (21-Oct-09) broken the long term resistance of Rs 45 with high volumes. It has fallen back to Rs 42 levels.
However the price charts, some basic indicators (like MACD)and some advanced indicators are suggesting that the stock should rally once it now clears past Rs 47/-. So medium term traders may buy on break above Rs 47 with stoploss kept near Rs 34/- for a target of initially Rs 65 and then Rs 77 Plus. . .
Happy trading !
CA Rajiv D Khatlawala
ValueTrade Academy Pvt Ltd.
Thursday, October 22, 2009
Nickel - Readying for second leg up!
The followers of my blog would have benefitted from the Nifty view ... Nifty did close near to the indicated down target of 5050 and has further weakened in afternoon trades today... I am sure most of you would have taken profits home . . . If not then remember the saying "One in hand is better than two in the bush"
Well as I watch multiple markets at a time, I presume the metals are again readying themselves for a second phase of up moves.. Copper, Zinc and Nickel especially . . .
I had indicated entry in Nickel in June at Rs 600 + levels on the triple bottom formation.. the target being Rs 900/- .. The target was achieved and surpassed as it tested Rs 1000/-.
Now it seems to be readying for another upmove... The advanced indicators (not shown here) are suggesting increasing momentum once it breaks above Rs 915/- .. Keep a stoploss at Rs 830 and target a price of 1135 initially and then Rs 1200 + ..
Multiple Market traders may want to shift focus from equities to commodities ... And yes we sure had a nice decent move in the USD INR in past few days. . .
CA Rajiv D Khatlawala
Valuetrade Academy Pvt Ltd.
Tuesday, October 20, 2009
Nifty - Divergence continues . . .
The Nifty opened with a good lead today but could not sustain and in fact closed lower. Conquering 5200 seems a heavy task for the Nifty. Moreover my observation has been that while Nifty is touching its recent highs , most of the frontline stocks are not! This itself suggests extreme caution to the trader.
On the daily charts, there is a small inverted hammer formation while the RSI remains in negative divergence . . .
The daily charts suggests a support of 5000 Nifty while intraday charts (not shown here) suggest weakness on close below 5050.. . .
While individual stocks may be positive, traders may reduce their exposure keeping in mind the RSI divergence ...
Be careful friends,
CA Rajiv D Khatlawala
Valuetrade Academy Pvt Ltd.
Friday, October 16, 2009
POWERGRID - A Diwali Pick!!!!
Before anything else ....
VALUETRADE Academy wishes you all a very happy Diwali and a Great NEW year ahead!
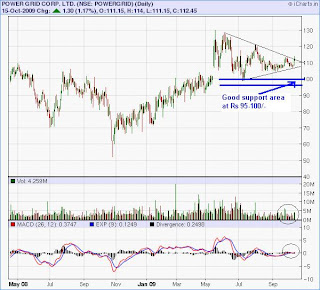
The first thing which comes to mind on the eve of Diwali is ' What to buy for 'Mahurat'? Definitely something which we can hold for long term and which we can buy currently at a reasonable level.
POWERGRID - seems to be just the prime pick for the medium term investor. . .
The technical formation is good , even the advanced indicators (not shown here) and retracement and extension analysis suggests strength developing...
A close above Rs 116 with volume expansion should give us the required signal to jump into the stock .... And support remains strong near Rs 100/- levels ( My Basic course participants will know why !)
On break out , expect a 40% plus target in a few weeks ....
Happy Diwali once again!
CA Rajiv D Khatlawala
Valuetrade Academy Pvt Ltd.
Wednesday, October 14, 2009
Bombay Dyeing - good for L/T
GOLD (my previous analysis) is now nearing the upward break out.
As for Nifty, the IIP numbers are once again positive. A double digit industrial growth is surely a positive.
The Nifty (as analysed earlier) is now closing below 4930... Till that happens , don't become bearish... Buy trades may be taken - with caution ofcourse.
Bombay dyeing gave a 'technical break out' yesterday. On the medium to long term charts, the trend is positive.
I expect that a break and close above 430/- will give an intial target of Rs 490 and a longer term target of Rs 550 Plus. Keep SL near Rs 375 after thebreak out occurs.
Those of you in an around Baroda may note that the next Batch of Basic Technical Analysis workshop will commence Nov 2 (Tuesday) and Advanced Technical Analysis Workshop will commence on Nov 6 (Friday) - You may email me if interested
Happy trading !
CA Rajiv D Khatlawala
Valuetrade Academy Pvt Ltd.
Friday, October 9, 2009
This DIWALI should u buy Gold (Futures) ?
GOLD hit the headlines a couple of days back as it broke to a multi-years high in dollar terms. It broke the previous level of $1034 ( I had analysed Gold sometime back suggesting that this should happen) .
But in rupee terms, we are still below the all time high of Rs 16000/-. The simple reason is the crash of the USD INR.
It is currently stuck in the range of 15500 and 16000 and a break out is imminent. I expect the USDINR to now become stable (even RBI is worried about the last 3 days volatility) . Given the expected stability of the currency, I expect a break out of Rs 16000 more likely.
Traders may buy on break out with a stoploss near Rs 15500 for a minimum move of Rs 1000 - Rs 1200 in days to come...
This should become more likely especially if the world markets start correcting.
Happy GOLD trading this Diwali...
CA Rajiv D Khatlawala
Thursday, October 8, 2009
Reliance - Diwali BONUS!!
The news od Reliance giving a 1:1 bonus hit headlines . Reliance sure has a way to surprise markets and marketmen ... (many a times i wonder even Mukesh Ambani may be surprised later at his own decision)....
Is it a gimmick ? Or does Reliance really see a great future 3, 5 or 8 years ahead ??? (ooops Fibonacci numbers not intended!)
Whatever that may be , but today's market reaction was suggesting that players are not comfortable and sense something fishy ! ... Is it to counter ADAG ? Or is it a bigger strategy- may be of a global scale??? Possible.
Technically however in the short to medium term one may see some selling pressure. Investors who are convinced of the growth (or who are Diehard RIL fans) may use this opporunity to wait a while before jumping in to the stock.
One may be more comfortable buying the stock near to 1900- 1950. Also till it remains below the crucial 2200, upmoves will have selling pressures.
Happy Bonus grabbing !!
CA Rajiv D Khatlawala
Monday, October 5, 2009
Nifty - signs of long awaited reversal !!
Tomorrow's pink papers should read something like this . . . .
"The Nifty fell by 80 points. Nifty falls below the crucial psychological 5000 level and closes just near it. Many sectors saw profit booking. "
Well, a perfect set up for the technical minded to look out for early reversal signs ... Check the following:
1. Evening star formation
2. A negative divergence on RSI and
3. A falling momentum
Surely the strength of the rally is giving early signals of fatigue. Yesterday I had mentioned tht the markets are quite 'nervous' and it seems todays movement confirmed the fear.
Moreover as indicated yesterday, profit booking stoploss has been triggered and now one should remain on the sidelines and condier short sell on close below 4960 or a break below 4930... !!
The additional signals indicated above should increase the confidence level of the short seller - once it breaks below 4960...
I presume one can now turn positive only if the markets breach the 5100 levels .. till that time - its 'correction' time!
Happy trading
CA Rajiv D Khatlawala
Sunday, October 4, 2009
Nifty - bullish and nervous !
The nifty's movement seems to be 'supportive' rather than the usual 'leading' in nature. By remaining positive, it seems to be supporting stocks to achieve their respecive highs.
It is spending much time in the vicinity of 5000 (+ or - 100 points around 5000). It is still bullish but surely nervous. And a nervous market is always riskier for the investor / trader. Sudden moves are 'normal' as markets get nervous. With the world markets seeing corrections, it is 'likely' that the needed correction sets in.
In all probabilities it may be a deep but fast correction. There are a lot of similarities between the market rally of 2003 and the current one. But it may be too early to conclude on this similarity.
I shall keep a trailing stoploss at 5020-5000 now and try to book profits if the markets try to move beyond 5125-5140. Only break below 4900 can qualify for short selling.
Happy trading !
CA Rajiv D Khatlawala
Thursday, September 24, 2009
Index inverse H&S ??? NOT QUITE!!!
Many market players are taken by surprise by the current stock market rally the world over. But what seems to be more confusing the analysts is the 'price patterns' that the markets are making!!
Many known technical analysts are indicating that the Nifty / Sensex has an 'inverse head and shoulder' price pattern. In fact they have even computed targets for the indices based on this pattern.
I, for one, tend to humbly defer.
The price pattern in the Nifty / Sensex is NOT an inverse H&S, even though it looks like one. Just because a pattern looks like an inverse H&S does not make it one.
Think about this : What is an inverse H&S and what are its characteristics ??
It is a 'REVERSAL' pattern and it reverses a down trend. If that is the case the first thing to look for is the basic trend.
Check the chart above .. Do you see a down trend ??? My question to the learned analysts is "If there is no down trend then, what will the pattern reverse??"
I have always emphasised in my practical workshops about the placement of a pattern and this is one example of the objectiveness to be used in applying technical analysis.
Happy trading!
CA Rajiv D Khatlawala
Friday, September 18, 2009
Gitanjali - A gem to catch!!
The Nifty tested 5000 yesterday ... I was infact expecting that some one might release 5000 balloons from the NSE terrace !! But nothing of that sort happened, sadly.
While the Nifty and the frontliners keep most traders confused, there is huge 'operator' activity in the mid caps. One such stock which is positive in Gitanjali Gems ...
The chart pattern looks like a Cup and handle and there is also a triangle in the recent price formation.
A break above 124 should see some good activity , especially given that the volumes have recently picked up.
Enjoy the mid-cap ride, while it lasts !
CA Rajiv D Khatlawala
Saturday, September 12, 2009
To be (bullish) or not to be – is the question!
Commodities Traders amongst you would have got decent and quick returns in NAT GAS. Well the Equity markets were not so hyper active. While on week-to week basis they are showing a gain of more than 3%, many stocks are witnessing profit booking.
The World markets are acting as if World GDP is going to gallop in the next few months !! Let's see what's happening in the world financial markets:
One of the major news as far as the world markets is concerned was that last week GOLD crossed the psychological $1000. This is an interesting phenomenon.
All of the world’s financial markets are rising – Gold, Crude, Base Metals, Stocks, Agro Commodities and also most currencies (against the dollar). Historically there has been a inverse relationship between many of these ‘asset classes’- for instance when stocks fall, Gold rises or say when Crude oil rises, the stocks fall.
But these logical relationships seem no longer valid. Is this a temporary phenomenon? Will the inverse relationship restore in coming days? Time will tell.
But one thing seems pretty sure – all the financial markets are rising mainly on account of the huge liquidity in terms of huge stimulus packages given. And most of this stimulus is ‘financed’ by China!
This may be the reason that the Bank of China gave a statement that ‘there is a bubble in stocks and commodities, not only in China but everywhere’. And if this bubble were to burst , it will be a huge blow to the ‘signs of recovery’ which is being promoted by governments the world over.
While previous few weeks saw the US markets outperforming the Asian markets, last week it was the turn of Asian markets to outperform – (another indication of rotation of money?).
Indian markets are treading cautiously... Investors too must do the same - be extremely careful! 4700 Nifty should be the Crucial support below which traders and investors should exit all longs !
Take Care !
CA Rajiv D Khatlawala
Tuesday, September 8, 2009
NAT GAS - A Morning Star!
Regular visitors on my blog would have observed that my IOC target was reached yday. Also those of you trading in GOLD also witnessed the breaching of the $1000 mark - indicated as early as mid-july when price was $935. NIFTY meanwhile is busy breaking out- though volumes are not supportive (more on Nifty in my next post)
NAT GAS traders (including yours truly) are waiting for a reversal signal. A few days back we almost got a rounding bottom, but unfortunately the break out did not occur. So the rounding theory went blank.
At the current juncture after seeing a panic price fall below Rs 120, it is showing a 'Morning Star' candle stick pattern . This is a classic japanese candlestick reversal pattern and is also considered quite powerful.
A break above Rs 137 should trigger a buying for the 'risk takers' who may keep stops at 121 and target price of Rs 160 -173 in coming days.
Happy trading
CA Rajiv D Khatlawala
Wednesday, September 2, 2009
Nifty - 4500 seems Crucial - very crucial !!!!!
The Nifty has had most analysts confused . But it seems that if one combines basic fundamentals and basic technical knowledge, it is not as confusing.
Fundamentals are suggesting weakness but the buyouancy in world markets and hence FII's positive sentiment - seems to keep the indices up (the technical part).
But now it seems we may be nearing a convergence of the technicals and the fundamentals!
The charts above tries to provide a different view - you may observe that the trendlines drawn are different than many may have drawn on the charts.
A break below 4500 would surely make me wait longer for buying in to the markets.
Happy trading (or no trading, should we say?)
CA Rajiv D Khatlawala
Monday, August 31, 2009
CAIRN India - a Techno Fundamental pick
Hello Friends ,
Extremely sorry for being irregular in blogging . Last couple of weeks have been hectic.
The markets are hovering around the resistance level of 4700 - with bulls and bears deciding what to do...
But activity is quite positive in mid caps. One stock which you may want to accumulate as a techno fundamental pick is CAIRN India.
Below are the technicals - I will try to post the 'fundamental basis' too here later.
Accumulate between 220 -265 for medium to long term...
Happy trading ! (and i foresee more blogging in the future) !
CA Rajiv D Khatlawala
Friday, August 21, 2009
USDINR . . . readying to take off!!!!
In one of my earlier posts I have mentioned about the inverse correlation between the USDINR and the Indian stock markets. In fact the correlation co-effecient is near (-)85% which is a high inverse relation.
while the Nifty movement seems to be 'confusing' I thought let me get some idea from the USDINR.
The above chart indicates that the USDINR is currently in 'bullish mode' - MACD too is suggesting it. Moreover it has made a higher low formation and I expect that a break and close above Rs 49.10 should trigger the anticipated rally in the dollar.
This will be more so considering that our FM is willing to increase imports of foodgrains (because of drought) and at the same time ban export of food grain. Logically this should lead to a depreciation in the rupee. A break above Rs 49.10 will tell us that such a thing will happen!!
Price is the king - remember?
Happy trading !!!
CA Rajiv D Khatlawala
Head of Research & Training
JHAVERI Securities Ltd.
Tuesday, August 18, 2009
IOC... the contrarian
OIL PSUs are going against the markets - the contrarians
In last few days the Nifty fell more than 5% while OIL PSUs including IOC rose by 5% +...
The technical indicators are quite positive with the MACD also signalling an upward bias.
The above chart suggests investors can accumulate this with SL placed at 525/- (yes a little far off) for medium term targets of Rs 650 and Rs 725...
Also considering the weak market situation, you may want to buy lesser quantity than usual for any 'buy' indications...
Happy trading !
CA Rajiv D Khatlawala
Head of Research & Training
JHAVERI Securities Ltd.
Tuesday, August 11, 2009
Nifty - targetting sub-4000 ??
The Nifty got strong resistance at the level above 4700 and it seems the FIIs sold heavily near 4700 Nifty ,while as usual, the retail investor saw himself holding the baby!
The last three working days almost gave the candle pattern usually referred to as 'Three black Crows" This is a reversal pattern which remains intact till the high of the first candle is broken.
The MACD too indicates losing of momentum of the upmove and is giving a negative divergence.
The correction, if worldwide / asian factors worsen, can lead us to sub-4000 levels - which will be one of the few opportunities to grab stocks at lower levels !
Happy trading
CA Rajiv D Khatlawala
Head of Research & Training
JHAVERI Securities Ltd.
Friday, August 7, 2009
NAT GAS - Long term trend about to change !
Metals on the commodities exchanges are having a good run (as expected ) while the stock markets are taking a breather after a good run up ...
Nickel and Zinc (among other metals) moved quite well and I presume those of you who traded could get good benefit...
I thought of re-visiting 'Nat Gas' where it seems that the 'bottoming out' process is still on... I expected it to complete the bottoming formation last month. But 'technically' speaking the more time a security takes to bottom out , the more fierce should be the subsequent action... Copper and Nickel are recent examples - as both went up 50% in less than 2 months.
I Presume price fall in Nat Gas can be used to add positions and a break out of the Rs 205 level should give us the needed signal of the completion of bottoming out.
Even the long term RSI which I use, is suggesting an impending change in trend.
Positional Traders ... be ready for action ....
Happy trading!
CA Rajiv D Khatlawala
Head of Research & Training
JHAVERI Securities Ltd.
Saturday, August 1, 2009
"PASSING THE PARCEL"- The game is on!!!
Friends . . . .
We are now just near to the 52 week high – a psychologically satisfying level. Most market players, across the world, believe that - not only the worst is over but also that the much awaited ‘economic revival’ has started. While we are not sure whether economic revival has really started or not, one thing we are sure is that ‘investor sentiments’ has improved dramatically.
As they say “Stocks don’t sell for what they are actually worth; but rather, they sell for what investors ‘think’ what they are worth’. Extend this saying to the market and that is what we are witnessing. Every one believes that economic recovery has started. And like always, all investors – retail, HNI, Mutual funds, FIIs, et al, usually follow the mass thinking – usually referred to as ‘herd mentality’.
Now here is an open secret - the main reason all of us are buying today is ? - 'BECAUSE THE PRICE IS GOING UP'
And pray , this is not necessary a virtue of the Indians alone .....
Going by something what we may call a ‘world wide rotating investor sentiment’, it seems that the Asian markets rally because the US and European markets are positive and in turn the US and European markets rally because the Asian markets are positive!
The roller coaster is spinning - and spinning quite fast . We can equate this to the 'Passing the Parcel' game we enjoyed - not so long ago. While we may enjoy the game, don't forget to get down on the first signs of trouble .. Because otherwise the 'Big players' as usual, will exit leaving the 'ball' in order hands !
Happy trading !
CA Rajiv D Khatlawala
Head of Research & Training
JHAVERI Securities Ltd.
Subscribe to:
Posts (Atom)