Thursday, November 27, 2008
Nifty- 2950 likely!!
The Nifty rallied yesterday (Wed) to close positively at 2752 points. While every day is a new day for the markets nowadays, the daily chart suggests some possibility of an upward break of 2800 which should lead us to near 2950+.
Support remains at 2630 for now and unless that is broken the above targets should hold.
CA Rajiv D Khatlawala
Head of Research and Training
Jhaveri Securities
Saturday, November 22, 2008
The SENSEX -a techno-fundamental evaluation
Report written by CA Rajiv D Khatlawala on 14 November 08
The global financial panic has led to a sell off in the world markets. The emerging markets have fallen in fact much more than their counterparts in the US and European countries.
The most logical reason is that they had risen too fast and too much and hence its correction too would logically be fast and deep.
Should we, the investors, then be surprised by the speed and extent of the fall?
But beneath the gloom and doom and talks of 5000 and 6000 Sensex levels, I thought we should visit the long term charts to check whether we are over-reacting (as usual).
The Fundamental view
Fundamentally speaking, we expect a growth rate of GDP of more than 6.5-7%. We are therefore not at all in a recession. (A recession is when an economy has negative growth in two consecutive quarters). So what we are witnessing is a ‘slowdown’- that we cannot deny.
But, as investors, we are supposed to look ahead not behind. In situations as today, the recent-past events like the Lehman collapse, the bailouts etc will have a high amount of weight in the investors’ minds. But it is necessary and crucial now to look ahead. Past history tells us that such major financial or social crises have sown the seeds for next bull market and thus as investors, instead of shying away from it, we need to prepare ourselves for it.
The markets have fallen more than 60% from their peak and the current Price to Earnings multiple (P/E) of the Sensex is about 11 x. As a thumb rule, investors are normally ready to pay a premium of about 2 to 2.5 times the growth rate – this means that assuming a GDP growth of even 6.5% , the P/E multiples should be about 13 to 16 times. This itself indicates the undervaluation of the Sensex at current sub-10000 levels by about 30%!
The Technical View
The monthly chart of the Sensex suggests that we are in a long term bull market, though in the short term we are witnessing bearishness.
On the monthly chart given below (from 1979 till date), you would observe that the rising trend line joining the highs from 1992 to 2002, is now ready to give the Sensex support. In fact the Sensex tested this support level in the recent panic sell off when it touched 7700 level.
A technical analyst would view this as good support and our view is that the possibility of the recent low being broken is very less.
It must be remembered that peaks are generally made during ‘euphoria’ and troughs are made in ‘panics’. And, in all probabilities, the panic sell off seems to be over.
It is therefore a good time for the investors to look ahead, rather than behind, and try to overcome the daily mood swings of a volatile market.
It did not take much time (only six months) for investors world over to turn from bullish to bearish and the probability is high that in similar time, we will find ourselves scrambling to buy stocks again!
The following is the monthly chart of the Sensex right from 1979 base year.
This report is prepared by CA Rajiv D Khatlawala, Head – Research and Training, Jhaveri Securities Ltd. Please give credits in case you want to reproduce it on your blog / elsewhere. Thank You!
Tuesday, November 18, 2008
NIFTY - correction complete ? ?
The Nifty remained weak on the back of weak asian markets following news that Japanese economy has slipped in to a recession.
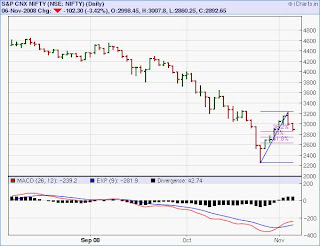
The Nifty closed weaker at 2683 much below the 50% retracement level of 2755. However it is now much near to the 61.80% retracement level (2645) of the rise from the panic low of 2252 to the 3240 level.
I expect that a close tomorrow (Nov 19) above 2780 should lead to further follow up buying to 2850 - 2900 levels in the next 2-3 days.
Happy trading !!
CA Rajiv D Khatlawala
Head Research & Training
Jhaveri Securities Ltd
Baroda
Monday, November 17, 2008
ZINC - Signs of bottoming !!!
The NIFTY fell below the crucial 2750 level in intraday before closing back near its previous close of 2800. On daily charts it has given a Doji and I would expect further buying on tuesday on a break above 2840. Support remains at 2750.
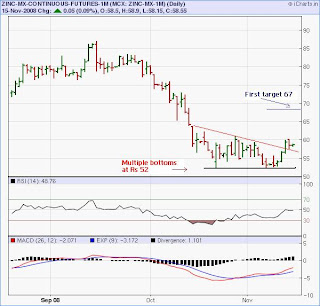
The ZINC commodity has been witnessing support at Rs 52 levels and is currently at Rs 58. There is what we call a 'double bottom' formation at Rs 52 which is a 'trend reversal' pattern.
I expect further buying to occur on break above Rs it's recent high of Rs 60/- on which the expected target will be Rs 67/-.
Happy Trading !
CA Rajiv D Khatlawala
Head - Research and Training
Jhaveri Securities Ltd.
Wednesday, November 12, 2008
USD/INR ... moving towards resistance!
The Nifty broke the important support level of 2860 and closed lower at 2848. I expect a test a Rs 2750. Resistance is at 3050-3100. A break of 3100 now will be positive.
The USD INR has taken a 38.20% retracement at Rs 47 and has started rising again and is currently quoting at 49.20.
We can expect a re-test of 50.30 where it may have some selling pressure / resistance. On the lower side, consider Rs 47 as crucial support now below which one can expect further down move.
I presume that a break out of Rs 47 on the USDINR and 3100 Nifty may coincide!!
Happy trading!!
CA Rajiv D Khatlawala
Head (Research and Training)
Jhaveri Securities Ltd.
Monday, November 10, 2008
NIFTY - Inverse H & S in the making ???
Nice rally in Nifty today.
It has closed positively at 3148 indicating a break out on the closing price chart (line chart).
But what is interesting to note is the pattern being formed on the daily chart - an inverse head and shoulder reversal pattern. This is a pattern which has the potential to 'reverse' the down trend.
The neckline seems to be near 3175 above which one should expect further up moves - initially to 3325 and then beyond 3500. (Phew !!)
Moreover I expect the 'speed' of the rise to be faster since the Nifty has taken only a small retracement to the 38.20% level. ( You may refer my book for more discussions on retracement analysis and speed of a move)
While most news reports / analysts keep indicting us about the bad news ; the market wants to rise . I presume once again, the market is discounting the future - as usually it does!
Happy trading
CA Rajiv D Khatlawala
Head of Research and Training
Jhaveri Securities Ltd.
Friday, November 7, 2008
IDFC . . nearing break out!!
The Nifty movement has been interesting. It did not break 2860 retracement level and has started moving up again. Expect further buying and short covering on break above 3050!!
(Did you realize how sentiments change in a matter of days - from extreme bearish to moderately bullish !! - That's the capital markets for you, friends !)
Well one stock which is also fundamentally quite sound, is IDFC. It is nearing it's break out level near Rs 73.
One can buy on a break above Rs 75 with a stoploss near to Rs 63 for a target of 92-98 levels.
Happy trading !!
CA Rajiv D Khatlawala
Head of Training and Research
Jhaveri Securities Ltd.
Thursday, November 6, 2008
Nifty - correction still on !!
The Nifty movement was 'almost predictible'. the rally from 2250 to 3150 started correcting yesterday and one could almost feel that it would clearly test the fibonacci retracement level support of 2865 and 2754.
The first level was tested today. It is likely that the second level too may be tested in a couple of days.
In fact the best case scenario would be that the Nifty takes support at the second support level and then resumes it's upward journey. in such a scenario, we can surely have interesting targets !!
More of it when the price move develops!
Till then
Happy Trading !
CA Rajiv D Khatlawala
Head of Training and Research
Jhaveri Securities Ltd
Monday, November 3, 2008
Dollar Rupee .... time for correction!!
First of all - I hope your Diwali celebrations went off well - My best wishes for the New Year to all of you !!!
The Dollar Rupee Chart shows an interesting advance break out signal by the RSI which suggested a couple of days earlier that the Dollar will weaken against the Rupee.
Even the trendline support of Rs 48.70 is broken today. It seems the demand for Dollar from the FIIs has tapered off in past few days - which is also witnessed by the rally on the Indian stock markets inthe past four days.
Considering the Chart formations, I don't epect the Dollar to go beyond Rs 50.30 while on the down side, one can epect Rs 47 - 46.25 levels in the current corrective down move.
As far as Nifty is concerened, the rally is nearig the resistance level of 3125 level and if long you may try booking profits above 3100 Nifty.
Happy Trading
CA Rajiv D Khatlawala
Subscribe to:
Posts (Atom)