Tuesday, December 30, 2008

Nice Close !!!!


Nifty gave a positive close above 2960 (it closed at 2979). I presume this should be treated as a positive sign.

In short to medium term we may target 3080 - 3120 levels and then a re-test of the recent high of 3240.

Assume crucial support now as 2810.

I presume even the chart formation of BANK NIFTY is quite interesting and readers may want to evaluate it and post their comments on this blog !!!

Happy trading !!

CA Rajiv D Khatlawala
Head of Research and Training
Jhaveri Securities Ltd.

Wednesday, December 24, 2008

Nifty - readying for the next leg ?

The Nifty closed near an important support level today - at 2920.

The price formation of the Nifty along with medium term moving averages and retracement analysis suggest that a turn now from this level beyond 3000 should actually lead to a larger and speedy rally, beyond 3240.


Fundamentally it may coincide with the announcement of the stimulus package and the markets' reaction to it.

I would look forward for a close above 3000 to get a better cue on the next leg up.

Till then - wait and watch is the best mantra !!

Happy trading

CA Rajiv D Khatlawala
Head of Research and Training
Jhaveri Securities Ltd.

Friday, December 19, 2008

Nifty - at a critical juncture!


NIFTY 's rise has been slow and steady from the break out of 2800 and it touched a high of 3100+ today.

I presume there is strong resistance level of 3150-3175 on upside and on the lower side, a support at initially 2990 and then a crucial one at 2930. A break below 2930 would negate the current bullishness on the price charts.

While the Nifty is nearing overbought region, so are the frontline stocks. Most of them have reched their target resistance levels.

Happy trading

CA Rajiv D Khatlawala

Tuesday, December 16, 2008

IDFC - readying for another up move

At the outset, SORRY FRIENDS !!! I could not update the Blog for past few days as I was tied up in various activities / training sessions

Well since my last post, the market gave the anticipated break out on the up side and has today touched 10K again (Nifty 3K).

Just when all were busy worrying that the Sensex is set for 6000 , the markets rebounded and touched 10000! Nothing new - That's is usual for the markets to behave - only we technicians must have the faith to believe that 'they' are wrong once again!

One stock which has seen some good buying and has formed a double bottom trend reversal is IDFC - yes it remains my favorite.

The chart indicates that even the RSI and MACD gave positive divergences and more significantly the MACD has entered positive zone.


I expect some small resistance at Rs 75 and a target near to Rs 84-88 for the stock. Keep stoploss at Rs 59 for any long trading positions.

Happy trading !!

CA Rajiv D Khatlawala

Tuesday, December 2, 2008

NIFTY - at a crucial juncture !!!

The Nifty opened down gap today on the back of weak US and Asian markets but subsequently recoevered to close near yesterday's close.

Technically, specific advanced indicators are suggesting that we are near to a crucial technical trigger levels.

Resistance zone on upside is at 2800-2840 levels while support is near 2550-2575 levels. I expect that once these levels are crossed - either side break out - one should then see a 300 point Nifty move.


Many frontline stocks are near to support levels / previous low levels which were made when there was heavy FII selling. Now that FII are not selling heavily, the only logical conclusion can be of accumulation at lower levels (by interested parties)rather than actuall selling. Hence I am looking forward for a upward break out rather than a downward one.

Time shall tell but till then we keep our fingers crossed - ( which I think we already have done!!)

Happy Trading
CA Rajiv D Khatlawala
Head of Reasearch and Training
Jhaveri Securities Ltd.

Thursday, November 27, 2008

Nifty- 2950 likely!!


The Nifty rallied yesterday (Wed) to close positively at 2752 points. While every day is a new day for the markets nowadays, the daily chart suggests some possibility of an upward break of 2800 which should lead us to near 2950+.

Support remains at 2630 for now and unless that is broken the above targets should hold.

CA Rajiv D Khatlawala
Head of Research and Training
Jhaveri Securities

Saturday, November 22, 2008

The SENSEX -a techno-fundamental evaluation

Report written by CA Rajiv D Khatlawala on 14 November 08

The global financial panic has led to a sell off in the world markets. The emerging markets have fallen in fact much more than their counterparts in the US and European countries.

The most logical reason is that they had risen too fast and too much and hence its correction too would logically be fast and deep.

Should we, the investors, then be surprised by the speed and extent of the fall?

But beneath the gloom and doom and talks of 5000 and 6000 Sensex levels, I thought we should visit the long term charts to check whether we are over-reacting (as usual).

The Fundamental view
Fundamentally speaking, we expect a growth rate of GDP of more than 6.5-7%. We are therefore not at all in a recession. (A recession is when an economy has negative growth in two consecutive quarters). So what we are witnessing is a ‘slowdown’- that we cannot deny.

But, as investors, we are supposed to look ahead not behind. In situations as today, the recent-past events like the Lehman collapse, the bailouts etc will have a high amount of weight in the investors’ minds. But it is necessary and crucial now to look ahead. Past history tells us that such major financial or social crises have sown the seeds for next bull market and thus as investors, instead of shying away from it, we need to prepare ourselves for it.

The markets have fallen more than 60% from their peak and the current Price to Earnings multiple (P/E) of the Sensex is about 11 x. As a thumb rule, investors are normally ready to pay a premium of about 2 to 2.5 times the growth rate – this means that assuming a GDP growth of even 6.5% , the P/E multiples should be about 13 to 16 times. This itself indicates the undervaluation of the Sensex at current sub-10000 levels by about 30%!

The Technical View
The monthly chart of the Sensex suggests that we are in a long term bull market, though in the short term we are witnessing bearishness.

On the monthly chart given below (from 1979 till date), you would observe that the rising trend line joining the highs from 1992 to 2002, is now ready to give the Sensex support. In fact the Sensex tested this support level in the recent panic sell off when it touched 7700 level.

A technical analyst would view this as good support and our view is that the possibility of the recent low being broken is very less.

It must be remembered that peaks are generally made during ‘euphoria’ and troughs are made in ‘panics’. And, in all probabilities, the panic sell off seems to be over.

It is therefore a good time for the investors to look ahead, rather than behind, and try to overcome the daily mood swings of a volatile market.

It did not take much time (only six months) for investors world over to turn from bullish to bearish and the probability is high that in similar time, we will find ourselves scrambling to buy stocks again!

The following is the monthly chart of the Sensex right from 1979 base year.


This report is prepared by CA Rajiv D Khatlawala, Head – Research and Training, Jhaveri Securities Ltd. Please give credits in case you want to reproduce it on your blog / elsewhere. Thank You!

Tuesday, November 18, 2008

NIFTY - correction complete ? ?

The Nifty remained weak on the back of weak asian markets following news that Japanese economy has slipped in to a recession.


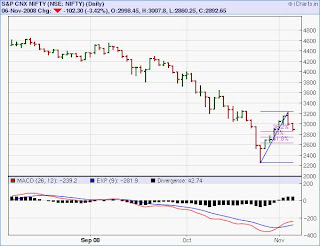
The Nifty closed weaker at 2683 much below the 50% retracement level of 2755. However it is now much near to the 61.80% retracement level (2645) of the rise from the panic low of 2252 to the 3240 level.

I expect that a close tomorrow (Nov 19) above 2780 should lead to further follow up buying to 2850 - 2900 levels in the next 2-3 days.

Happy trading !!

CA Rajiv D Khatlawala
Head Research & Training
Jhaveri Securities Ltd
Baroda

Monday, November 17, 2008

ZINC - Signs of bottoming !!!

The NIFTY fell below the crucial 2750 level in intraday before closing back near its previous close of 2800. On daily charts it has given a Doji and I would expect further buying on tuesday on a break above 2840. Support remains at 2750.

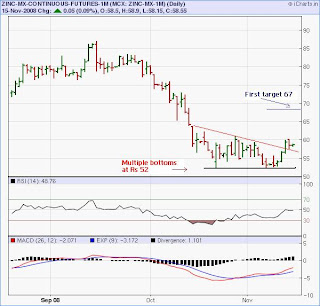
The ZINC commodity has been witnessing support at Rs 52 levels and is currently at Rs 58. There is what we call a 'double bottom' formation at Rs 52 which is a 'trend reversal' pattern.


I expect further buying to occur on break above Rs it's recent high of Rs 60/- on which the expected target will be Rs 67/-.

Happy Trading !

CA Rajiv D Khatlawala
Head - Research and Training
Jhaveri Securities Ltd
.

Wednesday, November 12, 2008

USD/INR ... moving towards resistance!

The Nifty broke the important support level of 2860 and closed lower at 2848. I expect a test a Rs 2750. Resistance is at 3050-3100. A break of 3100 now will be positive.

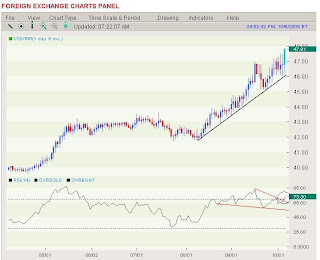
The USD INR has taken a 38.20% retracement at Rs 47 and has started rising again and is currently quoting at 49.20.


We can expect a re-test of 50.30 where it may have some selling pressure / resistance. On the lower side, consider Rs 47 as crucial support now below which one can expect further down move.

I presume that a break out of Rs 47 on the USDINR and 3100 Nifty may coincide!!

Happy trading!!

CA Rajiv D Khatlawala
Head (Research and Training)
Jhaveri Securities Ltd
.

Monday, November 10, 2008

NIFTY - Inverse H & S in the making ???

Nice rally in Nifty today.

It has closed positively at 3148 indicating a break out on the closing price chart (line chart).

But what is interesting to note is the pattern being formed on the daily chart - an inverse head and shoulder reversal pattern. This is a pattern which has the potential to 'reverse' the down trend.


The neckline seems to be near 3175 above which one should expect further up moves - initially to 3325 and then beyond 3500. (Phew !!)

Moreover I expect the 'speed' of the rise to be faster since the Nifty has taken only a small retracement to the 38.20% level. ( You may refer my book for more discussions on retracement analysis and speed of a move)

While most news reports / analysts keep indicting us about the bad news ; the market wants to rise . I presume once again, the market is discounting the future - as usually it does!

Happy trading

CA Rajiv D Khatlawala
Head of Research and Training
Jhaveri Securities Ltd.

Friday, November 7, 2008

IDFC . . nearing break out!!

The Nifty movement has been interesting. It did not break 2860 retracement level and has started moving up again. Expect further buying and short covering on break above 3050!!

(Did you realize how sentiments change in a matter of days - from extreme bearish to moderately bullish !! - That's the capital markets for you, friends !)

Well one stock which is also fundamentally quite sound, is IDFC. It is nearing it's break out level near Rs 73.


One can buy on a break above Rs 75 with a stoploss near to Rs 63 for a target of 92-98 levels.

Happy trading !!

CA Rajiv D Khatlawala
Head of Training and Research
Jhaveri Securities Ltd.

Thursday, November 6, 2008

Nifty - correction still on !!

The Nifty movement was 'almost predictible'. the rally from 2250 to 3150 started correcting yesterday and one could almost feel that it would clearly test the fibonacci retracement level support of 2865 and 2754.


The first level was tested today. It is likely that the second level too may be tested in a couple of days.

In fact the best case scenario would be that the Nifty takes support at the second support level and then resumes it's upward journey. in such a scenario, we can surely have interesting targets !!

More of it when the price move develops!

Till then

Happy Trading !

CA Rajiv D Khatlawala
Head of Training and Research
Jhaveri Securities Ltd

Monday, November 3, 2008

Dollar Rupee .... time for correction!!

First of all - I hope your Diwali celebrations went off well - My best wishes for the New Year to all of you !!!

The Dollar Rupee Chart shows an interesting advance break out signal by the RSI which suggested a couple of days earlier that the Dollar will weaken against the Rupee.

Even the trendline support of Rs 48.70 is broken today. It seems the demand for Dollar from the FIIs has tapered off in past few days - which is also witnessed by the rally on the Indian stock markets inthe past four days.


Considering the Chart formations, I don't epect the Dollar to go beyond Rs 50.30 while on the down side, one can epect Rs 47 - 46.25 levels in the current corrective down move.

As far as Nifty is concerened, the rally is nearig the resistance level of 3125 level and if long you may try booking profits above 3100 Nifty.

Happy Trading

CA Rajiv D Khatlawala

Monday, October 27, 2008

Can this 'Hammer' stall the fall? ? ?

Dear Friends

The Nifty's today's move was quite interesting. After crashing almost 11%+ the market reversed direction (could have been anticipated on the intraday chart) and closed near it's previous close - giving what the japanese call a'hammer'

Usually this pattern is suggestive of exhaustion of the current trend ( which is down) and one can expect to see some buying momentum at least for the short term.


Technically a break above Nifty 2605 now can lead to a rally near the 2800 and 3000 Nifty zone. Use price fall now to add to your positions.

And yes - don't forget that 'hammers' and 'inverted hammers' have been successful in reversing trends in the past !

Happy trading !

CA Rajiv D Khatlawala

Saturday, October 25, 2008

Hey Technicians ! Its time to check the fundamentals!

Let me be frank.
I have always believed that fundamental analysis works only in bull markets and that too merely because someone needs to find out a convincing reason to justify the increase in stock prices.

All along the past four years of bull market from 2003 – 2007, corporate fundamentals were surely getting stronger and the Indian growth story was justifying the rise in stock prices. But just reflect. All along, however, the major reason for the stock prices to rise dramatically was the unabated flow of foreign money.

Corporate fundamentals were but a small reason for the increased stock prices. Good fundamentals would have driven the price of, say, Reliance say from Rs 600 levels to say Rs 1500 or even Rs 1800. But it was surely the foreign money chasing stocks, that took the price to the ‘excessive’ Rs 3000 plus levels. May be, in case of other stocks, the blow up was much larger.

It was a clear case of prices overshooting much beyond fundamentals. What we are currently witnessing is then a ‘correction’ of this excessiveness.

Followers , and believers ,of the science of technical analysis, like me, were finding it hard to believe it; while at the same time the growing breed of fundamental analysts came up with equally convincing reasons to actually justify the price excesses!

Even as the technicians saw ‘topping patterns’ like the ‘Head and Shoulder’ pattern on the Sensex , the fundamental analysts continued to believed that achieving a 8% plus GDP growth for the next few years was ‘easy’ and obvious!. These growth rates were even factored in their EPS projections!

Yes, yes, I do sound like a thorough critic of fundamental analysis. But that is only partially true. In fact, as a hard lined follower of the science technical analysis, I believe that it is actually time now to refresh our knowledge of fundamental analysis.

Every bear market sows the seeds of the next bull market and at this current juncture; we need to seriously carry out a ‘techno-fundamental’ analysis which would be able to tell us well in advance about the next Bull Run. We need it in order to tell us the most likely price and time reversal signals, and also the stocks and sectors which will lead the next bull market.

When these things will start, time- as well as price charts - will tell. Right now I am busy carrying out techno fundamental analysis – something I had not done in the past couple of years!!

Friends - Do give your feedback on the articles.

CA Rajiv D Khatlawala
Head of Research - Jhaveri Securities Ltd.

Thursday, October 23, 2008

The Paradox of RISK

That investments do carry a risk with them was reiterated by the current market sell off where not only second line stocks but even the so-called ‘bluechips’ or ‘bell weather’ stocks fell like nine pins !

Just ten months back, who would have imagined in their wildest dreams, that India’s most popular stock - Reliance Industries, quoting then at Rs 3000 plus, would be available to investors at near a third of the price – at Rs 1300!. Or, for that matter, even Larsen, the ‘robust’ company known widely to have an order book position full for the next three years would fall to third of its value, from the high of Rs 4500 to the current pre bonus equivalent price of 1600 ( ex bonus price is Rs 800).

Examples galore. Many frontline stocks in the ‘hot’ sector of Real Estate like DLF have seen their prices being eroded by more than 75% ! .

And ask anyone whether they would want to buy these stocks, now that they are available at one-third or one-fourth of their peak values? The most likely answer will be a resounding NO!. Today people feel that the ‘risk’ of investing in stocks is high.

This brings us to the paradox of risk – When the perceived risk is high (like today), the real risk is actually low. Conversely, when the perceived risk is low (like what it was before the Jan 08 fall), the real risk is actually high.

It is this psychology of the crowd that a true investor has to capitalize on and take advantage. These are the extreme cases when contrarians can benefit.

It is a fact also that markets generally react extremely during up trends as well as down trends. Up trends give rise to mass euphoria while down trends provide panics and fear. And the investor who is able to identify such market conditions can benefit hugely from it.

In the current scenario, we are well witnessing the signs of a panic among investors. The media too is adding fuel to fire as headlines scream of the markets hitting new lows and of disappointing pictures of market crashes.

These could well be signals of perceived risk today being high; and therefore the real risk being quite low.

CA Rajiv D Khatlawala
Head of Research - Jhaveri Securities Ltd.

Thursday, October 16, 2008

Markets - the supreme teacher!!

The US meltdown, triggered by the collapse of Lehman Brothers, and the consequent fall in the world financial markets has had multiple repercussions. However, perhaps this fall may act as a good lesson to investors for the future – presuming they remember it the next time!

The first lesson which investors must learn is, simply, that all investments, whether in bluechips or other stocks, will and do carry a risk. The past four year rally in the world stock markets made investors presume that higher returns came free of cost! It may be important not to forget that any investment carries risk – some have lower risk while some like equities have higher risks.

Secondly, as investors, let us all recognize and accept that what goes up, comes down and consequently what goes down, comes up too. In January this year, not many investors would have been ready for such a sell off and such low prices as we see today. Similarly, a year from now, probably many investors may perhaps realize that the 10000 Sensex level was a good buying opportunity, which should not have been missed!

Thirdly, such sell offs in the stock markets present tempting value picks to investors who have the capacity to hold. As the saying goes “Buy when there is blood on the streets”. Not too far back in time, panics during the post Harshad Mehta Scam and even the post ICE sector meltdown, gave great value picks to investors who had the waiting capacity.

Fourthly, while stock markets the world over have fallen heavily, precious metals like Gold and Silver saw a bullish trend. Even the USD against the Rupee (USDINR) saw a good 20% rise. This suggests that, in future, as investors we need to be more diversified in terms of spreading our portfolio to different asset classes and not just equity.

And the fifth learning for the investor may be to remind himself that this is ‘not the end of the world’. Historically speaking such crashes have occurred from time to time and more importantly, they have acted as a base for a much stronger economic growth in subsequent years.

CA Rajiv D Khatlawala

Monday, October 6, 2008

Dollar - on a new high!!

The NIFTY today gave the long standing target of 3650 and fell further to close at 3602. The Sensex has in the meantime broken below the crucial 12000 mark and has closed at 11800. While we may have some relief rallies, we should expect 10500-10000 levels in the next few weeks.

The USDINR too has picked up pace and is nearing 48/- . Currently it is quotaing at 47.85 and seems to be targeting its all time high at 49.08. Nowadays a Rs 1/- movement in the dollar seems quite normal and volatility has increased dramatically.


On the charts though we see a negative divergence, you would also clearly observe that the divergence is not getting 'confirmed' as the swing break out has not occured. This suggests the possibility of a further rise beyond Rs 48/-.

Any long positions will now have a stoploss of Rs 46/-

I presume it is the right time to open the currency futures trading account with the broker!!

Happy Trading

CA Rajiv D Khatlawala

Wednesday, October 1, 2008

Lehman Bros and the 'Black Swan'

The Lehman Brothers collapse – a confirmation of ‘The Black Swan’
(By CA Rajiv D Khatlawala )

The theory of the Black swan was described by Nassim Nicholas Taleb in his best seller book – “The Black Swan” published in 2007. It is an interesting book which examines the impact of the highly improbable.

The term Black Swan comes from an ancient Western idea that ‘All Swans are White’ and hence ‘the black swan’ is something which could never exist; something which can never occur. However when Black Swans were discovered in Australia, the ‘commonly accepted belief’ was questioned.

Taleb, in fact, claims that almost all events in world history which are of consequence have come from the ‘unexpected’ and the unplanned. He cites that the attack on World Trade Centre is one such historical event which could not have been anticipated but it has consequently and subsequently changed and influenced world events dramatically.

Consider the latest financial turmoil we all find ourselves - the collapse of the 158 year old ‘robust’ financial firm Lehman Brothers is nothing short of a ‘Black Swan’. No one believed that, such a thing as this would ever happen. There was a ‘commonly accepted belief’, that such huge companies cannot go bankrupt, no matter what happens. But it did happen and I think once more we seem to get a living proof of ‘the impact of the improbable’.

And it is beyond doubt that this ‘black swan’ event, has and will, change financial history (and probably even world history). It is only hoped that we do not have a series of such ‘black swan’ events. We surely don’t need so fast a change in world history!!

It may not be wrong to say that even in the financial markets; we should all expect the unexpected! As investors and traders, we need to factor in the unexpected – the unpredictable, and only then we shall have consistency in investment profits.

CA Rajiv D Khatlawala

Silver - - not as worth as gold !!

Silver on the MCX (as also on the comex) has been underperforming Gold. Usually my observation has been that in uptrends, Silver outperforms Gold. But the markets have the notorious habit of proving traders wrong. It is the traders who have to be careful in 'generalizing'an observation.

Lucky for me as I was constantly tracking Gold rather than silver.


The chart shows that Silver on MCX has a strong resistance near Rs 21500 and long term support near Rs 18000/-. Also even though the recent price move has been downward, the positive divergence on the charts indicate upward bias.

Happy trading (and observing)

CA Rajiv D Khatlawala

Friday, September 26, 2008

Nifty - negative weekly close

Global cues and markets are not at all in favour of stabilization of the financial markets with the US still hung over the 700 billion Dollar bailout. Many analysts feel that whether the bail out occurs or not - the US may be heading for further trouble.


The Nifty has given a negative weekly close and the daily charts are in fact also suggesting a further down move, initially to test the previous low of 3800 and a break below which one can expect the target of 3600 levels.

Happy (?!) trading
CA Rajiv D Khatlawala

Tuesday, September 23, 2008

SBI - can u bank on it????

Nifty touched the indicated level of 4140 and went below it on close. The next immediate level is 4100 and below that 4070. Consider resistance at 4175 and 4220.

Among the stocks to fall today after a couple of days of stagnation, was SBI.


It is getting strong resistance near Rs 1600 levels and if you notice on the chart, it is a classic case of an earlier support becoming a resistance level.

I expect that a break below 1450 should lead to further fall. Overall trend of the stock can be consider weak unless it crosses Rs 1625 on upside. Even Bank Nifty has a downward bias on the intraday charts as it broke today below 6200.

CA Rajiv D Khatlawala

Monday, September 22, 2008

ZINC ... signs of trend reversal!

The Nifty made a doji (almost) today just near a crucial resistance level.

Consider 4200 as a crucial support level and a break below this should give a down target of 4140 - 4100 levels. Resistance is strong at 4270 on intraday charts.

It would be interesting to track Dow Jones today - if it does not revive after a $700 billion booster ; I wonder what else can save the US economy from further deterioration!

ZINC METAL on the MCX is showing some signs of trend reversal. The metal has good support now near Rs 78.50 levels on the MCX. Expect a target of Rs 88.50 in the short term and Rs 92-93 in the medium term.


The chart above is self explanatory

CA Rajiv D Khatlawala

Saturday, September 20, 2008

NIFTY ! some temporary relief?

Nifty moved almost 10% from it'a low of 3800 of thursday. Many traders and investors may have already concluded the end of the bearish phase.

But we technicans are too rigid ! I am still tempted to maintain that a ban or curb on short selling by regulatory bodies the world over cannot be a reason for a long term investor to jump in with his money ( Also, I wonder why they did not have a 'buying long' ban in January ????)

Look at it this way - why should regulatory bodies need to do such a thing as curbing short selling ? simply, because they fear that, if left to itself, the markets may witness further selling pressure, which is the result of an already grown financial crises the world over.

And I have my doubt whether this will settle down soon. Our downtrend is still 'young' - only 9 months old and we may still have another quarter to go before we see light!!

The chart below is more or less self explanatory


Happy trading !!

CA RAjiv D Khatlawala

Thursday, September 18, 2008

GOLD - Glittering bright!!

The Nifty movement today was psychological one- it seems. It touched it's recent low of near 3800 levels on opening with a gap down and the most likely scenario was that the bearish sentiment would not continue. The participants of my workshops know why !!

But the next time the Nifty tries to retest those levels, it will most likely break them. Lets keep our fingers crossed. For tomorrow (Friday) 4075-4090 is a resistance area while crucial support is at 4010.

GOLD made a historic run yesterday in the international market when it rallied more than $80 in a single day. In the Indian markets too , after taking crucial support at 11000+ levels, it has rebounded. Fundamental analysis attribute this to a shift of funds in to Gold due to the financial crises faced the world over, after the Lehman bankrupcy.


Consider the bullish trend in Bullion intact till the Rs 11000/- level holds. In the upward momentum, I expect that GOLD on MCX may reach a newer high, much before it does in New York.
Happy Trading!

CA Rajiv D Khatlawala

Tuesday, September 16, 2008

IDFC - - near long term support!

The Nifty has had a roller coaster ride for the past two days - courtesy Lehman Bros. and Merryl lynch

Consider 4035 as a crucial support for intraday and 3980 on daily charts.


IDFC got hammered and quoted near it last years crucial support level of 78. I have given the weekly chart of IDFC and you would observe that there is long term support for the stock between Rs 66 and Rs 78/-.

I presume longer term traders (popularly known as investors)can buy the stock in this range with a 10% stop and hold.

Happy Trading

CA Rajiv D Khatlawala

Friday, September 12, 2008

Power Grid - powering ahead

One interesting stock in this falling market is POWER GRID.

It has crucial support at Rs 88/- and I expect that a break above Rs 101 will lead to further buying in the stock , irrespective of the market direction.


The target should be at Rs 127-130 levels

Nifty in the meantime has crucial support at 4200 and a break below this should make it test 4000 levels in the near future.

Happy Trading,

CA Rajiv D Khatlawala
Head - Training and Research
Jhaveri Securities Ltd.
Thursday, September 11, 2008

CRUDE -- will it Flare again??

NIFTY seems to be filling back the gap created by the nuclear deal news on Monday. And this gap filling was expected - when the overall trend is down, such gaps will be immediately filled.

Moreover one thing was still more relevant in this case - 'Stand alone Events cannot change market trends'

Going now to CRUDE OIL, which nowadays is on everyone's watch list, we saw a level of 102 being tested. On the MCX the Crude oil touched the equivalent low of Rs 4610/-.


The technical view is that on the MCX, it is likely to take support near the Rs 4500 levels. However in the international markets, it should take support near $ 100. The difference between the local levels and international levels is influenced by the rupee depreciation.

On taking support at Rs 4500/-, one can expect a rebound towards the 5100 price area - indicating correspondingly an 8 - 10% upmove in Crude (in dollar terms).

Happy Trading

CA Rajiv D Khatlawala

Monday, September 8, 2008

DLF- changing trend????

The NSG Waiver rally today made the Nifty jump more than 200 point and it ultimately closed up by 130 points. The Gap created may be filled up sooner than later.

For intraday consider support at 4465 below which immediate target is 4420. Upper resistance is at 4515 and 4545. Only a close above 4545 should be considered positive.


DLF is making an intersting pattern and a break above 540 should trigger further buying for a target at Rs 615/-. Keep stop initially at 490 and on break above Rs 575it can be trailed to Rs 520/-.

Longer Term investors too can buy the break out and keep stoploss at Rs 460 and hold for higher targets.

Happy Trading

CA Rajiv D Khatlawala

Friday, September 5, 2008

Nifty .. Near Crucial weekly support

The Nifty got resistance from it's falling trendline drawn from the high of May 2, 2008.

The weekly charts have shown a 'doji' formation suggesting indicesion after an attempt to cross 4500+ on the higher side.


For the coming week consider 4285 as the crucial support level and 4490 as the key break out level. A close below 4250 next week will trigger a fresh round of selling which can break the resistance-turned-support level of 4200

The weekly pivot point is at 4385 which can act as a resistance / support area for the coming week.

The technical indicators too are in indecision mode and may confirm the sell signals on a break below 4285.

Happy Trading

CA Rajiv D Khatlawala

Monday, September 1, 2008

Moser Baer - reversal on cards?


MOSERBAER has formed a triple bottom at the price of near Rs 88/- and is consolidating between 106 and Rs 90 for some time now.

I expect that a break out of Rs 106.50 ( especially with volumes) will give a target of Rs 132-135 in the short term.
In the medium term one can expect still higher prices.

All longs will need to have a stop at sub Rs 90 levels.

Happy Trading

CA Rajiv D Khatlawala

Friday, August 29, 2008

Currency Futures – A Welcome development !!

The Currency market which was till now restricted to banks and companies having foreign exchange exposure, is now being opened up to the retail investor. The NSE will launch currency futures from August 29th. Let us ponder over some of the key features on this new instrument.

The need for Currency Futures:
1. The opening up of the currency markets through derivatives seems to be a move towards the ultimate goal of the government - introduction of Full Capital Account Convertibility (FCAC). A well balanced and robust derivatives mechanism can surely give the government the needed confidence to move ahead with FCAC.
2. Secondly the recent volatility in the Rupee dollar in India (along with the above normal volatility in the currency markets the world over) may be curtailed, at least to some extent, by increasing the number of players. This can be achieved through the currency futures.
3. The introduction of currency futures is likely to bring down the transaction cost of many companies who currently have to deal with banks at a relatively higher cost.
4. Also the opening up of the commodities exchange necessitated currency futures. The reason was that many internationally traded commodities like base metals, precious metal and crude oil were traded on the Indian commodities markets in Rupee terms. However, currency fluctuations do affect commodity prices to a large extent, while the traders in Indian commodities market could not hedge against it..

Meaning: Currency futures are standardized foreign exchange contracts traded on an exchange to buy or sell one currency against another on a specified future date.

Some key features of the currency futures in India are as follows:

a. At present trading will be allowed in only USD/INR
b. Each currency futures contract will be worth $1000 (USD One Thousand)
c. Each currency futures contract will be quoted in Rupee terms but the outstanding positions will be in dollar terms
d. Each contract shall have a maximum maturity of 12 months.
e. All monthly maturities from Month 1 to Month 12 will be available at a given point of time.
f. The currency market will be open from 9 am to 5 pm
g. Settlement will be done on expiry in Indian Rupee only
h. The settlement price will be the RBI Reference rate on the date of expiry. The methodology of computing the RBI reference rate will be publicly disclosed (It is currently not done)
i. The settlement date will be the last business day of the month and time of settlement will be 12 noon.
j. The initial margin will be a minimum 1.75% on the fist day of the currency future trading and minimum 1% thereafter.
k. At present FIIs and NRIs are not permitted to trade in currency futures market.

Conclusion
While currency futures can be used effectively for hedging by companies and traders alike, it is expected to generate a lot of retail participation for purpose of trading and speculation. The small lot size is indicative of this.

Considering the greater transparency, efficiency, liquidity and accessibility that it will bring, it can be expected that investors will lap up this too.

CA Rajiv D Khatlawala

Wednesday, August 27, 2008

RPL - Caveat Emptor !!!

The Nifty fell below the intraday support level of 4315 and closed lower at below 4300. As indicated earlier, the likely hood of 4225 is higher. Resistance remains at 4355-4375 range.

RPL seems to be witnessing selling pressure and the major support is at 156. RSI as well as the other advanced indicators are suggesting weakness, especially if it breaks and closes below 154/-.


Down target could be initially at 147 and then 141/-. Upmoves are likely to face resistance at 163.50 levels

As they say 'Caveat Emptor' ( meaning 'Buyer Beware')

Happy trading !

CA Rajiv D Khatlawala

Tuesday, August 26, 2008

Tech Mahindra - short move ahead

The Nifty closed today at the same levels as yesterday. Consider 4380 as crucial resistance and 4300 as support for tomorrow. We have two days of doji candles - indecisions suggesting the confused state of the market.

TECH MAHINDRA seems to be consolidating for some time now before resuming its upmove.


Consider 745 as crucial support. The technical indicators / patterns suggest a move intiially to 865-880 and then a close above 890 will give a further move up.

Happy Trading

CA Rajiv D Khatlawala

Gold - Is the Shine fading ?

The Indian markets continue to reel under pressure as the Nifty / Sensex are not able to sustain upmove / up gaps. Down target of 4225 and 4165 are seeming more likely, seeing the selling pressure. Some relief to the bulls can come only on the Nifty rising above 4405 - till then bulls may go in hibernation!!!


GOLD has been stuck in a range of $ 790 and $ 835 in international markets while in Indian commodity exchanges, it is stuck in the range of Rs 11200 and Rs 12000/-. A break out of this range can provide good trading opportunity to traders.

A break below Rs 11000/- can lead it to test Rs 10450 - 10250 levels while on the upside, gold will resume it's bullishness on close above 12050/-. Watch out for these levels. We may say it is the 'calm before the storm!'

Happy trading

CA Rajiv D Khatlawala

Saturday, August 23, 2008

DISH TV . . .Watch IT ! again....!

The Nifty retraced some of it's loss and closed near the resistance level of 4325. Consider 4285 -90 as crucial support level for Monday. There is an expectation of up gap open considering that the Dow Jones was up 200 points. Upmoves in Nifty have resistance at 4380 - 4405 levels.

Dish TV is one stock which has witnessed higher volumes in recent days at lower price levels. They may be suggestive of accumulation.


Condsider up break out at Rs 40.75 for a medium term target of Rs 47 and then Rs 52-53/-. It is likely to face resistance at 52+ levels. Consider Rs 35 as the crucial support for the upmove.

Happy Trading

CA Rajiv D Khatlawala

Thursday, August 21, 2008

Nifty - Ooops ...is it Deja Vu ????

The Nifty moved as expected and achieved the target of 4270. Since the crucial support of 4316 was broken , selling aggravated in mainline counters as expected.

The Nifty's recent run up from 3800 to 4600 and it's subsequent fall seems like we have already seens something like this before - not long before !!. It is clear deja vu.


The above chart indicates the movement for the Nifty along with the 'long term' MACD indicator (chart updated as of Wed Aug 20).

The next target for the Nifty in it's fall is 4225 and then at 4165. Upmoves will have resistance at 4325 and then 4370.

Will the Nifty movement be similar to what we saw June and July ? Till will surely tell . Till that time the only alternative for us is to become 'Traders' rather than 'Investors'

Happy trading

CA Rajiv D Khatlawala

Wednesday, August 20, 2008

CAIRN India . . .

The Nifty went near to the resistance area of 4440. For tomorrow resistance remains initially at 4440 and then at 4480-4490 levels. Consider 4380 as crucial intraday support and 4315 as support on the daily charts.

CAIRN India has been taking support near the 200 DMA for some time. The range has been Rs 230 and 249 and I expect either side break out, however the bais is towards an upside break ...


Buy on break above Rs 248 with Stop near 229 for a target of 275 and then 283/-... Exit any long if it breaks Rs 229/-

Happy Trading

CA Rajiv D Khatlawala

Tuesday, August 19, 2008

HCC - short term move !!!

The Nifty which remain below the crucial 4360 during the day but rallied in the last half hour to close higehr at 4368. Upmoves will have resistance at 4395 and 4430 while support is at 4350.

HCC has been moving in a channel for some time and yesterday it has taken support at the lower end . It had also give a hammer.


A break above 102 should give a short term target near 112-114 levels and stops must be kept at 95.50.

Upmoves in the Nifty / stocks may at present be treated corrective only. Other technical indicators are suggesting weakness on the daily charts.

Happy trading

CA Rajiv D Khatlawala

Monday, August 18, 2008

Reliance - readying to fall ?

The Nifty remained weak as expected and indicated on Thursday. Consider 4360 as the crucial support below which further selling may be expected. Resistance on upside is at 4445 and 4470 levels.

RELIANCE has broken below it's important support line and is also quoiting below it's 200 DMA. The current fall is with a negative divergence and hence I expect that further selling may be witnessed on the counter. This inturn will affect overall sentiments too.


Consider Rs.2208 as intraday support level for tommorow below which initial target should be Rs 2175 and then 2153/-. Resistance on updie is strong at 2245-2255 levels.

My down target of RPL has been achieved. Presume you all could trade the downside !!!
Happy Trading

CA Rajiv D Khatlawala

Thursday, August 14, 2008

Nifty - Warning ...Caution Ahead !

The Nifty broke the important intraday support level of 4465 and fell further to close weak at 4430. In fact the trendline support on daily charts was broken yesterday itself.

Being the last day of the week , i was tempted to see the weekly chart and it suggests caution - extreme caution!


On the weekly Nifty chart, there is a 'bearish engulfing' candlestick pattern which indicates a halt to the past few weeks of upmove. Technically it is a reversal pattern and one should expect further selling pressure in the week to come.

The entire structure would fail only if the current weeks high of 4650 is broken on upside especially with volume. On lower side, likelyhood of downward targets near 4330-4270 is more likely in next few days.

Happy trading

CA Rajiv D Khatlawala

Wednesday, August 13, 2008

SPARC - likely to create sparks!!!


SPARC an offshoot of Sun Pharma has been seeing some buying interest recently. The technical pattern is that of a rounding bottom.

The scrip is consolidating in the range of 80/- and 90/- for past two months. Upside resistance is at 92-93 levels and I expect that a break above this should give investors a target price of 110 initially and then 118-120/-.

Post break out, all longs must have a stop near Rs 80/-

Happy trading!

CA Rajiv D Khatlawala

Monday, August 11, 2008

IDFC - readying for a move!

IDFC has been consolidating in the range of Rs 90 and 110 for a long time and in the process it has also given multiple positive divergences on the RSI. MACD signal line too is in buy mode and nearing zero line.


The recent price movement is giving indications of a rounding pattern.

The break out is at 112 for a target of Rs 137-140 while Rs 99 remains a crucial support once break out occurs.

Investors may buy partially at current levels of Rs 105-107 and add on break out.

{The blog will undergo a MAJOR change in a couple of days. Till that time, there may be some delays/hiccups}

Happy Trading

CA Rajiv D Khatlawala

Thursday, August 7, 2008

NIFTY - Quite indecisive!!!


The Nifty movements have been quite indecisive in the last two days. There were two consecutive 'inverted hammers' suggested selling pressure at higher levels near of 4600.

Consider 4480 as crucial intraday support level and a break below this should lead to profit booking in other index heavyweights. On break of this support, expect levels of 4415 and then 4365.

Upmoves are likely to face resistance at 4585 and stronger at 4640

Happy trading

CA Rajiv D Khatlawala

Wednesday, August 6, 2008

RPL - signs of Fatigue ????

The Nifty got some resistance yesterday at near 4450-4475 levels but once the break-out came , it was more or less certain that the next target should be 4540+ (This was indicated on 30-July-08 post)

One stock which went ahead of the market was RPL which rose from 160/- to Rs 175 in past five days. Now while the market is rising, this stock is showing some signs of fatigue.


Resistance is strong at 175+ levels and it is under performing the overall market on intraday charts.

Consider 168.50 as crucial support. A break below this can lead to further selling in the stock to a level of 155-158 price zone. Keep stop at 175 for any short positions.

Those who are aware of how to practically use option strategies can take good advantage of the current technical structure !!

Most of the stocks evaluated when Nifty was near 4150-4200 levels have achieved targets in about last 10 days. Presume you have taken advantage and booked profits

Happy Trading

CA Rajiv D Khatlawala

Monday, August 4, 2008

HCC - short term move to test 110!

(Friends, I was away for three days and so could not post on the blog. Sorry for the inconvenience!!)

The Nifty gave a good move up on Friday but is finding resistance near it's earlier support level near 4450-4475 levels. If you remember , post the crash, the Nifty took support near 4450 many times before it fell off to 3800.

During the fall one stock which still has some short term upmove left is HINDUSTAN CONSTRUCTION (HCC) currently quoting at 92/-


I expect that a break above Rs 95.50 should lead it to the 105-110 zone where it should then find resistance. Observe the 'flag' pattern on the charts. Increase in volume in recent trades is an added positive sign.

After break out , keep stop loss near 89/- !!!

AND YES - I SHALL BE MAKING AN IMPORTANT ANNOUNCEMENT IN A COUPLE OF DAYS .. Be Posted on the blog !!!

Happy trading

CA Rajiv D Khatlawala

Thursday, July 31, 2008

Divis Lab - waiting for break out !!

Today , on the last day of derivatives expiration of July contracts ,the Nifty revolved around the weekly pivot and also could not go beyond the important resistance level of 4353 indicated yesterday.

Consider crucial support now at 4275 and resistance at 4353-4360 levels.

DIVISLAB is one stock which has remained low key during the past few days and the price chart formations suggest that a break out can be expected any time.


The break out level is at Rs 1440/- and short term traders can enter the stock on break out for a target of near Rs 1600/-. Keep stop loss at 1375 being important support level on intraday charts.

Even the basic and advanced indicators should support the possible break out and a volume pick up should add to the speed of the move.

I hope inflation figures to be announced today post market are 'in line with expectations' though they may be able to give only a temporary impact. The fact that RBI has cut the Repo and CRR recently suggest that it is clearly worried. It has done so, even though they are aware that it may slow down the growth rate - but the RBI governor has to choose the lesser evil and inflation containment is a clear priority.

Happy trading

CA Rajiv D Khatlawala

Wednesday, July 30, 2008

NIFTY - good recovery !!


The NIFTY opened in up gap today and closed near the day's high, recovering yesterday's fall almost entirely.

The weekly pivot is at 4308 and the Nifty has closed above that.

Upmoves may face resistance initially at 4353 and on a break above this level, the likely target is at 4425.

The weekly charts suggests that medium term investors may now get worried only and only if 4075 is broken. Upward momentum will build up on a close above 4425 to retest the last week's high of 4539.

Short term players may, however, keep a stop loss at 4240 for any long positions.

The fall in Crude, among other things, is giving support to the market and if inflation figures are 'not bad'then above mentioned up targets are highly likely.

Happy trading !!

CA Rajiv D Khatlawala

Tuesday, July 29, 2008

BajajHind - turning sweeter!

The Nifty not only filled the gap created on the 'vote of confidence' day (I had indicated on Friday that it would try to fill the Gap) but also closed well below it at 4185. Consider 4265 as crucial level of resistance now. Below that level, assume the short term trend to be weak. And yes, my advanced course students were already aware 'why' I had indicated short selling below 4380!

Coming to scrip specific moves, I presume sugar stocks are likely to outperform the market. BAJAJHIND is one such stock which can become positive in a corrective upmove in the market.


Immediate resistance is at 160 and I expect that a break above Rs 160.75 should give a target of initially Rs 185-188 and then Rs 200/-. Consider Rs 146 as crucial support for any long positions.

You would notice that Rs 140 is the historical support level for a long time for the stock.

Happy trading!

CA Rajiv D Khatlawala

GOLD - corrective fall over ?

{SORRY FRIENDS, I COULD NOT POST ON MY BLOG YESTERDAY (Monday evening) DUE TO INCONSISTENT INTERNET CONNECTIVITY}

The Nifty remained sideways on Monday and has opened in down gap near 4250. In fact on Friday I had mentioned that the Nifty will try to fill the GAP made on the 'Vote of confidence' Day and this has happened today morning (Tue).

Turning our focus on GOLD at the current juncture, it makes interesting study on how trend lines can be useful in technical analysis.


In the above chart, you will observe that in the current corrective fall in GOLD from the high of 13500 levels, it has taken support at the resistance line drawn from the high of Mar 17th. This is a classic case of resistance becoming support price level.

Unless this 'resistance-turned-support' line in broken on down side, we can expect up momentum.

So any long positions should not be exited unless this level of Rs 12500/- is broken. Moreover, other indicators (not shown in the chart) suggest that a close now above Rs 13050/- will be further positive for the security. In dollar terms , a close above $935.50 will be positive and $920 will be the crucial support level.

And don't forget the general inverse relationship between Gold and equity!!

Happy trading !

CA Rajiv D Khatlawala

Friday, July 25, 2008

Crude Oil - 'Next is What?'

The NIFTY moved as expected and indicated. It closed down 112 points to close at 4320. I expect the Gap created on the 'Vote of confidence' day will soon get filled.

In the meanwhile, CRUDE OIL seems to be completing it's correction (oh no !!).

After reaching my target of Rs 5200/- yesterday, it bounced back to close at Rs 5307 thereby creating , what is known as a 'hammer' pattern in Japanese Candlestick terminology.


This bounce back should sooner or later give a move of another Rs 300/- in the short term i.e. to a price near Rs 5600/-.

Also If you observe the RSI which was in a negative divergence has now reached oversold region - a characteristic which I have explained in my book. The the possibility of a rebound to Rs 5600 is more likely.

Consider Rs 5200 as the crucial support for any long trade and only if that is broken expect further weakness.

Presume the week was quite profitable for all the bulls out there !!!!!

Happy trading

CA Rajiv D Khatlawala

Thursday, July 24, 2008

Zinc - Readying to rise ?

The Nifty got resistance at 4540 against the indicated level of 4560. It closed down at 4430 points. Today's low will be an important support and a break below that will trigger further selling. I presume all of you have book profits yesterday itself ( as suggested in previous blog posts)

My target in CRUDE OIL hits Bulls Eye- a few days back I had indicated that a break below 5800/- on MCX can take it to Rs 5200/-. Today it touched a low of 5191 and is currently at 5285/-.

The Metal ZINC (on MCX)is in an interesting bottom formation at current levels.


Though Zinc prices are under pressure, price falls are not creating significant lows. In fact it may be forming a rounding bottom having taken support at 76-77 levels for past few days.

Initial resistance is at 85/- and once this is crossed, I expect the prices to go towards 91/-.

Even Hindustan Zinc seems to be waiting for cues from the Zinc commodity. It is near to a break out on daily charts which is at Rs 575/-. Watch it in coming days !


Happy trading !!

CA Rajiv D Khatlawala

Wednesday, July 23, 2008

NIFTY - a 'nuclear blast off'!!

Woops !!!

The Nifty opened as expected with a huge gap and sustained its upmove. It rose well beyond my target of 4400 indicated on Friday.

Well, for most of my recent recommendations, the targets have been achieved or surpassed. Presume all of you could benefit.


The Nifty rise was huge - almost 235 points. But similar rallies have occurred at least four times in the past six months!!

The Nifty has cleared the 38.20% retracement and now may face resistance from the crucial 50% retracement which is placed at 4560. In all probabilities , the Nifty should form a 'doji' suggesting a halt to the upmove.

Whether it happens , time will tell. But it may be a good habit to keep booking profits. At the back of the mind , remember these are the corrective up moves that we are witnessing in an overall down trend.

Inflation data is due tomorrow . And I suppose market will now look out for economic data , the political situation being cleared yesterday.

While I may sound conservative, keep booking profit while you get them or at least protect yourself with derivatives!

Happy trading

CA Rajiv D Khatlawala